GDB Guide Part 2 - Breakpoints & Linux Calling Conventions
GDB Guides Series:
- GDB Guide Part 1 - Basics
- GDB Guide Part 2 - Breakpoints & Linux Calling Conventions
- GDB Guide Part 3 - Process Maps
- GDB Guide Part 4 - Examining Memory
- GDB Guide Part 5 - Stepping
- GDB Guide Part 6 - Automation
- GDB Guide Part 7 - Custom Commands
- GDB Guide Part 8 - Invoking Function Calls
1. Introduction
This post is a continuation from the previous post in this series and will cover more fundamentals on GDB and dynamic analysis.
To ensure this post is not too long-winded, I have decided to only go through the following topics today:
- Breakpoints
- Linux x86 vs x86_64 Calling Convention
2. Breakpoints
A breakpoint is a special marker that you can set in your program to tell GDB to pause (or “break”) the program’s execution when it reaches a certain point.
When you set a breakpoint at a specific line of code or address, GDB will make the program stop executing by inserting a int 3 instruction just before that point is reached.
2.1 Setting Breakpoints
(gdb) break [Function]
(gdb) break *[Address]
2.2 Regex Breakpoints
Apart from setting breakpoint at specific functions or addresses, there’s another cool trick to break on functions that match a regular expression.
# Break on every function available
(gdb) rbreak .

# Break on function that starts with "func_"
(gdb) rbreak ^func_.$

# Break on function that ends with "nc_1"
(gdb) rbreak .nc_1$
2.3 Viewing Breakpoints
When you have too many breakpoints and things start to get a little messy, you can list down your current breakpoints by doing the following command:
(gdb) info breakpoints

# Example Output
Num     Type           Disp Enb Address            What
1       breakpoint     keep y   0x000062086fb611d1 <func_1+8>
2       breakpoint     keep y   0x000062086fb61203 <func_2+8>
2.4 Deleting Breakpoints
If you have finished debugging at one of the breakpoints, you can delete them via the following command:
(gdb) delete breakpoints [Breakpoint Number]
If you need to delete more than one breakpoint, here are some other examples:
# If no number is specified, it will delete all breakpoints
(gdb) delete breakpoints

# Delete breakpoints 2, 4 and 6
(gdb) delete breakpoints 2 4 6

# Delete breakpoints 1 to 6
(gdb) delete breakpoints 1-6
2.5 Disabling / Enabling Breakpoints
Depending on the situation, you may also want to consider disabling and re-enabling certain breakpoints.
(gdb) disable breakpoints [Breakpoint Number]
(gdb) enable breakpoints [Breakpoint Number]
If you need to disable / enable more than one breakpoint, you can follow the syntax in Section 2.4
2.6 Conditional Breakpoints
At times you will find that your breakpoint keeps getting triggered by random sources and is generating too much noise.
In that case, you may consider adding a condition clause to the breakpoint.
(gdb) condition [Breakpoint Number] [....]
The example below demonstrates how to set a conditional breakpoint to func_1(), such that this breakpoint only triggers if valueAt(EBP + 0xC) == 0xD
(gdb) b func_1
(gdb) condition 1 {unsigned long}($ebp+0xc) == 0xd

# Alternatively
(gdb) condition 1 *(unsigned long *)($ebp+0xc) == 0xd
3. Linux Calling Conventions
Depending on the architecture, the way registers are “loaded” in memory will be different. Bear in mind that this section will not cover ARM. Perhaps in the future, I will do a separate post about it. For now, we will keep things simple and stick to x86(32 bit) and x86_64(64 bit) architectures.
3.1 32 Bit - x86
You can read the full details here, but if you just want the gist of it, the following diagram summarizes the x86 calling convention.
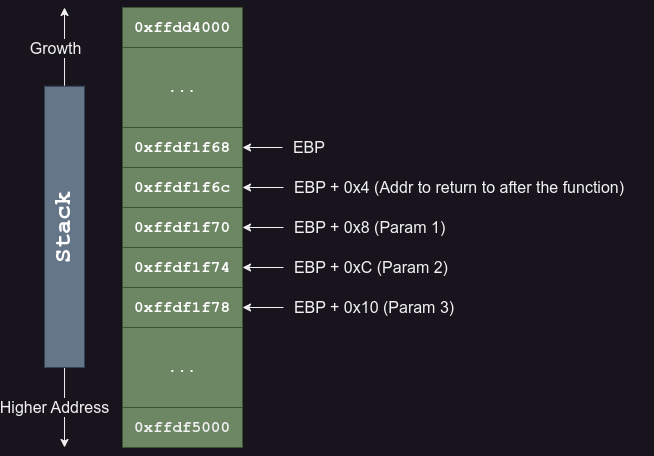
x86 Stack Frame
Following the above diagram as an example, if we have a function that takes in 3 parameters, the 3rd parameter will get pushed onto the stack first, followed by the 2nd then the 1st. 4 bytes after the address of EBP, it contains the return address after the function call.
Unlike 64 bit binaries, addresses are only stored as a 4-byte value.
We can actually test this out by compiling our test.c program shown previously in part 1 of the tutorial, as a 32 bit ELF binary.
$ gcc -m32 test.c -o test32
To practice what we have learned earlier, let us set a breakpoint on func_2() and print out its parameters and return address.
# Set the GDB configuration
(gdb) set pagination off
(gdb) set confirm off
(gdb) set output-radix 16
(gdb) set disassembly-flavor intel

# Set breakpoint at func_2 and continue
(gdb) b func_2
(gdb) continue

# In the process, select option 2 to trigger the breakpoint
## We know that param 1 is a char *.
## and param_2 is an unsigned long.
(gdb) set $param_1 = {char *}($ebp + 0x8)
(gdb) set $param_2 = {unsigned long}($ebp + 0xc)
(gdb) set $return_addr = {unsigned long}($ebp + 0x4)
(gdb) p (char *)$param_1
(gdb) p (unsigned long)$param_2
(gdb) p (void *)$return_addr
Demonstrating x86 Calling Convention
3.2 64 Bit - x86_64
The MIT documentation on 64-bit Linux does get straight to the point but lack concrete examples. Instead, I found out this other blog post talking about it and found it a lot more comprehensible. You could give it a read if you have the time.
For those of you who just want the TLDR, refer to the diagram below.
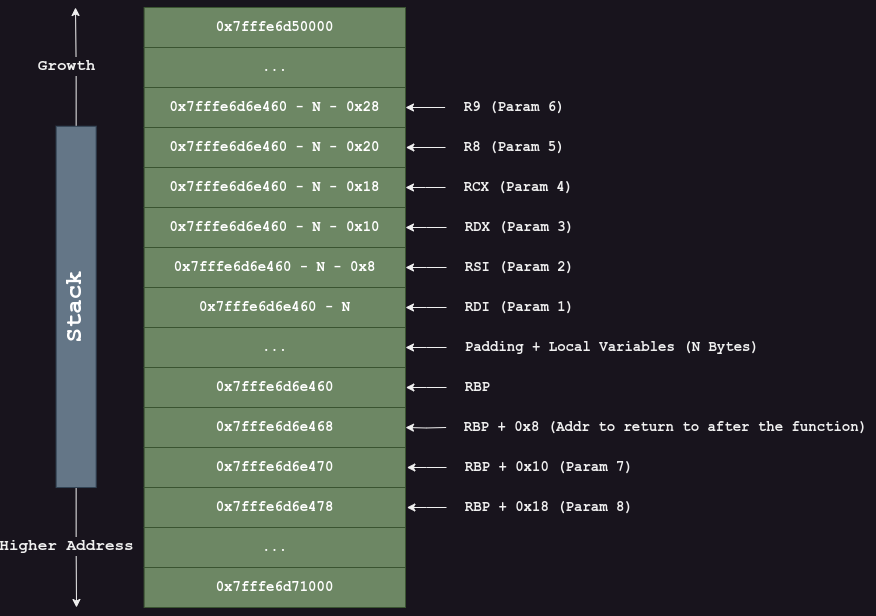
x86_64 Stack Frame
At the start of the function, the following parameters will be stored in its respective registers:
RDI— Param 1RSI— Param 2RDX— Param 3RCX— Param 4R8— Param 5R9— Param 6
This is followed by a set of instructions to push the values stored in RDI, RSI, RDX, RCX, R8 and R9 onto the stack sequentially.
The example below shows a possible set of instructions near the start of test_func() that takes in 6 parameters.
(gdb) disass test_func
Dump of assembler code for function test_func:
   0x00005988a0e0c1c9 <+0>:     endbr64
   0x00005988a0e0c1cd <+4>:     push   rbp
   0x00005988a0e0c1ce <+5>:     mov    rbp,rsp
   0x00005988a0e0c1d1 <+8>:     sub    rsp,0x20
   0x00005988a0e0c1d5 <+12>:    mov    QWORD PTR [rbp-0x8],rdi
   0x00005988a0e0c1d9 <+16>:    mov    QWORD PTR [rbp-0x10],rsi
   0x00005988a0e0c1dd <+20>:    mov    DWORD PTR [rbp-0x14],edx
   0x00005988a0e0c1e0 <+23>:    mov    DWORD PTR [rbp-0x18],ecx
   0x00005988a0e0c1e3 <+26>:    mov    DWORD PTR [rbp-0x1c],r8d
   0x00005988a0e0c1e7 <+30>:    mov    DWORD PTR [rbp-0x20],r9d
   0x00005988a0e0c1eb <+34>:    mov    rax,QWORD PTR [rbp-0x8]
Upon entry into test_func(), RIP is at <test_func+0>. At this point, all the parameter values are still stored in the 6 registers.
However, when the RIP is at <test_func+34>, the Stack Frame will be similar to the one shown in Figure 2.
Enough talking and let’s get to work!
Similar to the GDB exercise shown in Section 3.1, we will do the same here for a 64-bit binary. In case you haven’t compiled already, please run the following command to compile a 64-bit ELF binary:
$ gcc test.c -o test
Again, we shall do the same to set a breakpoint on func_2() and print out its parameters and return address.
# Set the GDB configuration
(gdb) set pagination off
(gdb) set confirm off
(gdb) set output-radix 16
(gdb) set disassembly-flavor intel

# Set breakpoint at func_2 and continue
(gdb) b func_2
(gdb) continue

# In the process, select option 2 to trigger the breakpoint
## We know that param 1 is a char *.
## and param_2 is an unsigned long.
(gdb) set $param_1 = $rdi
(gdb) set $param_2 = $rsi
(gdb) set $return_addr = {unsigned long long}($rbp + 0x8)
(gdb) p (char *)$param_1
(gdb) p (unsigned long)$param_2
(gdb) p (void *)$return_addr
Demonstrating x86_64 Calling Convention
4. Conclusion
Good job making it this far! There won’t be any more new posts for a while from now as Chinese New Year is around the corner.
Until then, keep practicing and stay awesome!
5. References
- x86 Calling Convention
- MIT x86-64 Architecture Guide
- IRed Team Blog - Linux x64 Calling Convention Stack Frame
6. Resources
GDB Guides Series:
- GDB Guide Part 1 - Basics
- GDB Guide Part 2 - Breakpoints & Linux Calling Conventions
- GDB Guide Part 3 - Process Maps
- GDB Guide Part 4 - Examining Memory
- GDB Guide Part 5 - Stepping
- GDB Guide Part 6 - Automation
- GDB Guide Part 7 - Custom Commands
- GDB Guide Part 8 - Invoking Function Calls